ETE能做什么
A Python framework for the construction, analysis and visualization of trees.
安装和使用
-
conda安装
# Install Minconda (you can ignore this step if you already have Anaconda/Miniconda) wget http://repo.continuum.io/miniconda/Miniconda-latest-Linux-x86_64.sh -O Miniconda-latest-Linux-x86_64.sh bash Miniconda-latest-Linux-x86_64.sh -b -p ~/anaconda/ export PATH=~/anaconda/bin:$PATH; # Install ETE conda install -c etetoolkit ete3 ete3_external_apps # Check installation ete3 version ete3 build check -
github源码安装
wget https://github.com/etetoolkit/ete/archive/master.zip -O ete3.20160719.zip
unzip ete3.20160719.zip
python setup.py install
yum install python-six.noarch
ete3 upgrade-external-tools
ETE运行
- 输入序列
- 输入序列为标准的fasta格式文件,名字可以为任意形式
- 如果需要在序列名字中区分物种信息,fasta序列名需满足
SpeciesCode_SequenceName例如HUMAN_p53 = HUMAN, p53。 可以通过参数--spname-delimiter指定使用其它字符作为分隔符。
-
ete预先定义了多个流程用以完成从原始fasta序列到后续进化树生成的各个步骤。
运行以下命令可以列出系统自带的流程及其解释
ete3 build workflows genetree -
使用既定流程最简单运行
-w指定所用的流程,-a指定输入序列,--tools-dir指定安装的外部程序的路径ete3 build -w standard_fasttree -a diTPS.prot.fa -o standard_fasttree --tools-dir /root/.etetoolkit/ext_apps-latest/ - 自己定制流程
-
获取可以定制的各部分命令
ete3 build apps -
选择预定义好的模块,如
tree builders:phyml_default_bootstrap,aligners:mafft_einsi,model testers:pmodeltest_full_slow,alg cleaners:trimal_gappyout. - 流程定制模板: 顺序为
aligner-trimmer-model_tester-builder- totally 4 parts included as stated above, multiple sequence alignment, trimming MSA results, select best model, use appropriate softwares to build tree.
-represents command separatornonerepresents skipping related operations
-
基于我们的选择定制的流程
mafft_einsi-trimal_gappyout-pmodeltest_full_slow-phyml_default_bootstrapete3 build -w mafft_einsi-trimal_gappyout-pmodeltest_full_slow-phyml_default_bootstrap -a diTPS.prot.fa -o custom_phymltree -
-w可以接受多个流程(空格分开),进而得到不同的比对工具、处理方式和建树工具 输出的多个结果,可以通过ete3 compare比较这些结果的吻合度, 比如Robinson-Foulds距离等。ete3 compare -r newtree1.nwq -t "tree2.nw tree3.nw tree4.nw" --unrooted # Tree file can be got using find find custom_phymltree -name *.nw - 定制不同的分析模块
-
查看已有分析模块的定义
ete3 build show phyml_default [phyml_default] _desc = Phyml tree using +G+I+F, 4 classes and aLRT branch supports. Default models JTT/GTR _app = phyml _aa_model = JTT -nt_model = GTR --pinv = e --alpha = e --nclasses = 4 -o = tlr -f = m --bootstrap = -2 -
修改部分定义获得新的模块
ete3 build show phyml_default >customized.config

## 修改后的customized.config

[phyml_bootstrap_100]
        _desc = Phyml tree using +G+I+F, 4 classes and aLRT branch supports. Default models JTT/GTR
         _app = phyml
    _aa_model = JTT
    -nt_model = GTR
       --pinv = e
      --alpha = e
   --nclasses = 4
           -o = tlr
           -f = m
  --bootstrap = 100
 [trimal_auto]
 	      _desc = trimal alignment cleaning using auto algorithm
   	      _app  = trimal
  -automated1 =

## 使用新定义的模块
ete3 build -a diTPS.prot.fa --clearall -o phyml_bootstrap_100 -w
mafft_einsi-trimal_auto-none-phyml_bootstrap_100 -c customized.cfg --cpu 5
-
-
-
氨基酸比对指导核苷酸比对的进化树构建 (要求氨基酸序列与核苷酸序列名字一一对应,核苷酸序列可以含有终止密码子,最终获得的核苷酸比对序列存储在
*.used_alg.fa文件中。)ete3 build -a diTPS.prot.fa -n diTPS.nucl.fa -o aa2nt -w standard_fasttree --clearall --nt-switch-threshold 0.9 -C 20 -
使用预先比对好的序列, 使用
none代替alignerete3 build -a diTPS.prot.aln.fa -w none-none-none-fasttree -o manual_alg --clearall -
设置树的根节点
from ete3 import Tree

tree = Tree('tree.nw')

root = 'one_node_name'
tree.set_outgroup(root)

#use mid-point as root
mid = tree.get_midpoint_outgroup()
tree.set_outgroup(mid)

tree.write('tree.rooted.nw')
tree.render('tree.rooted.pdf')
问题解决
-
ETE: cannot connect to X server 如果程序运行出现错误
ETE: cannot connect to X server则安装Xvfb, 并运行xvfb-run ete3取代ete3, 后面的代码不变。yum install xorg-x11-server-Xvfb.x86_64 xvfb-run ete3 build -w standard_fasttree -a diTPS.prot.fa -o standard_fasttree -
ETE: cannot connect to X server (solve in python script or jupyter ref)
- Install
xvfbwrapperusingpip install xvfbwrapper
# Add the following 4 lines at the beginning of python code # or the first cell in Jupyter from xvfbwrapper import Xvfb vdisplay = Xvfb() vdisplay.start() # launch stuff inside virtual display here # other python codes here # Add this line at the end of python code # or the last cell in Jupyter vdisplay.stop() - Install
-
External applications directory are not found 指定ETE使用的工具的安装路径;一般发生在普通用户使用根用户编译的ETE时。
--tools-dir /root/.etetoolkit/ext_apps-latest/
Tree annotation
# A virtual X-server XVFB is used in case you do not have X-server
from xvfbwrapper import Xvfb

vdisplay = Xvfb()
vdisplay.start()

# launch stuff inside virtual display here

#vdisplay.stop()


from ete3 import Tree, faces, TreeStyle, NodeStyle
from ete3 import ClusterTree, RectFace, AttrFace, ProfileFace, TextFace
from ete3.treeview.faces import add_face_to_node
import pandas as pd
import numpy as np
import colorsys
The most simple way of showing a tree.
t = Tree()
t.populate(7,names_library=['A','B','C','D','E','F','G'])
## %%liline is used for showing plots in ipythonnotebook.
## t.render(file_name="tree.pdf") # will save tree into pdf file
t.render(file_name="%%inline")
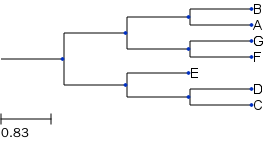
Get the randomly generated tree in newick format and save to a string variable which can be read using Tree() function.
t_str = t.write(outfile=None, format=0)
t_str

'(((B:1,A:1)1:1,(G:1,F:1)1:1)1:1,(E:1,(D:1,C:1)1:1)1:1);'
t = Tree(t_str)
ts = TreeStyle()
ts.show_leaf_name = True
ts.show_branch_length = True
ts.show_branch_support = True
t.render(file_name="%%inline", tree_style=ts)
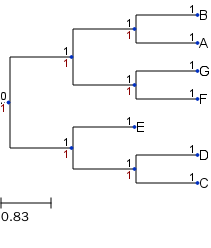
Get the randomly generated tree in newick format and save to file which can also be read using Tree() function.
t.write(outfile="tree.nw", format=0)
t = Tree("tree.nw")
ts.mode = "c"
ts.arc_start = -180 # 0 degrees = 3 o'clock
ts.arc_span = 180
t.render(file_name="%%inline", w=500, tree_style=ts)
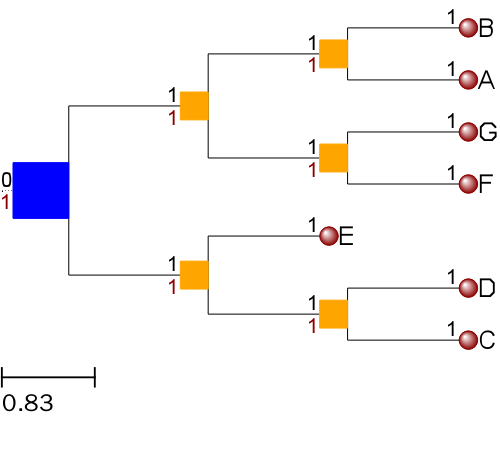
设置根节点、叶节点和中间节点的属性
ts = TreeStyle()
ts.show_leaf_name = True
ts.show_branch_length = True
ts.show_branch_support = True

# Draws nodes as small red spheres of diameter equal to 10 pixels
for n in t.traverse():  # Traverse each node and set attribute for each type of nodes
	if n.is_leaf(): # Decide if leaf node
		nstyle = NodeStyle()
		nstyle["shape"] = "sphere"
		nstyle["size"] = 10
		nstyle["fgcolor"] = "darkred"
		n.set_style(nstyle)
	else:
		nstyle = NodeStyle()
		nstyle["shape"] = "square"
		nstyle["size"] = 15
		nstyle["fgcolor"] = "orange"
		n.set_style(nstyle)

t.img_style["size"] = 30
t.img_style["fgcolor"] = "blue"

t.render(file_name="%%inline", w=500, tree_style=ts)
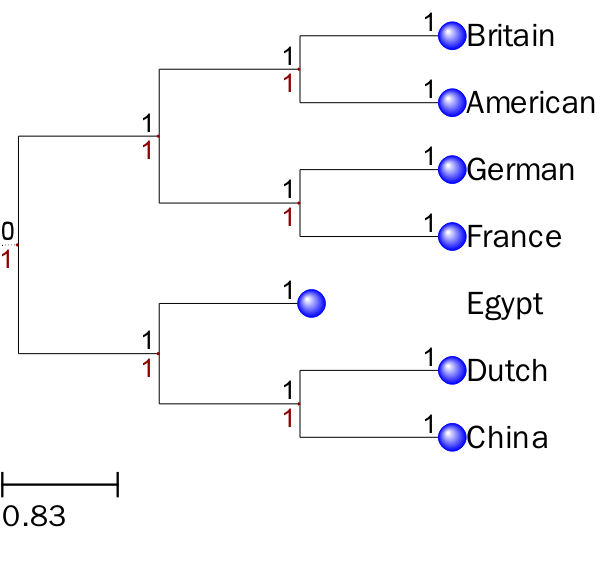
修改节点的名字
t = Tree(t_str)

nameMap = {'A': 'American', 'B': 'Britain', 'C':'China',
		   'D':'Dutch', 'E':'Egypt','F':'France','G':'German'}

ts = TreeStyle()
ts.show_leaf_name = False
ts.show_branch_length = True
ts.show_branch_support = True

# Creates my own layout function. I will use all previously created
# faces and will set different node styles depending on the type of
# node.
def mylayout(node):
	# If node is a leaf, add the nodes name and a its scientific
	# name
	if node.is_leaf():
		# We can also create faces on the fly
		newName = nameMap.get(node.name, node.name)
		newNameFace = faces.TextFace(newName)
		faces.add_face_to_node(newNameFace, node, column=1, aligned=True)

		# Sets the style of leaf nodes
		node.img_style["size"] = 12
		node.img_style["shape"] = "sphere"
		node.img_style["fgcolor"] = "blue"
	#If node is an internal node
	else:
		# Sets the style of internal nodes
		node.img_style["size"] = 1
		node.img_style["shape"] = "circle"
		node.img_style["fgcolor"] = "darkred"

ts.layout_fn = mylayout

t.img_style["size"] = 30
t.img_style["fgcolor"] = "black"

t.render(file_name="%%inline", w=600, tree_style=ts)
不同的节点设置不同的背景色,树枝的颜色
t = Tree(t_str)

nameMap = {'A': 'American', 'B': 'Britain', 'C':'China',
		   'D':'Dutch', 'E':'Egypt','F':'France','G':'German'}

colorMap = { 'American': '#ACFFFF',
			 'Britain': '#ACACFF',
			 'China': '#ACACAC',
			 'Dutch': '#59ACAC',
			 'Egypt': '#5959AC',
			 'France': '#595959',
			 'German': '#065959'}

ts = TreeStyle()
ts.show_leaf_name = False
ts.show_branch_length = True
ts.show_branch_support = True

# Creates my own layout function. I will use all previously created
# faces and will set different node styles depending on the type of
# node.
def mylayout(node):
	#Change branch color
	node.img_style["hz_line_color"] = 'orange'  # change horizontal branch color
	node.img_style["vt_line_color"] = 'red' # Change vertical branch color

	# If node is a leaf, add the nodes name and a its scientific
	# name
	if node.is_leaf():
		# We can also create faces on the fly
		newName = nameMap.get(node.name, node.name)
		newNameFace = faces.TextFace(newName)
		faces.add_face_to_node(newNameFace, node, column=1, aligned=True)

		# Sets the style of leaf nodes
		node.img_style["size"] = 12
		node.img_style["shape"] = "sphere"
		node.img_style["fgcolor"] = "blue"
		node.img_style["bgcolor"] = colorMap[newName]

		node.img_style["hz_line_color"] = 'blue'  # change branch color
	#If node is an internal node
	else:
		# Sets the style of internal nodes
		node.img_style["size"] = 1
		node.img_style["shape"] = "circle"
		node.img_style["fgcolor"] = "darkred"

ts.layout_fn = mylayout

t.img_style["size"] = 30
t.img_style["fgcolor"] = "black"

t.render(file_name="%%inline",tree_style=ts)
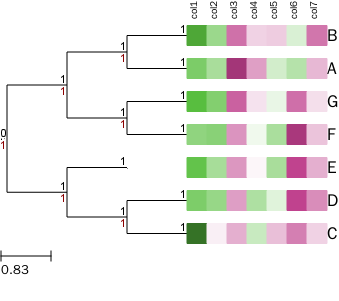
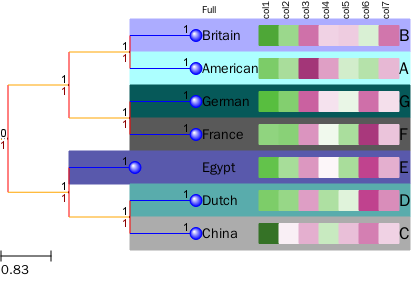
树+热图(自定义颜色+列名字)
自定义热图函数,同时该函数也支持替换或新增节点的名字。
nameFace = AttrFace("name", fsize=12) #Set leaf node attribute

def setup_heatmap(tree, tree_style, header, center_value=0.0, nameMap ={}, nameLabel = '',
				  color_up=0.7, color_down=0.2, color_center="white"):
	DEFAULT_COLOR_SATURATION = 0.5
	BASE_LIGHTNESS = 0.7
	def gradient_color(value, max_value, saturation=0.5, hue=0.1):
		def rgb2hex(rgb):
			return '#%02x%02x%02x' % rgb
		def hls2hex(h, l, s):
			return rgb2hex( tuple(map(lambda x: int(x*255),
						  colorsys.hls_to_rgb(h, l, s))))

		lightness = 1 - (value * BASE_LIGHTNESS) / max_value
		return hls2hex(hue, lightness, DEFAULT_COLOR_SATURATION)


	# Calculate max gradient value from the ClusterTree matrix
	maxv = abs(center_value - tree.arraytable._matrix_max)
	minv = abs(center_value - tree.arraytable._matrix_min)
	if center_value <= tree.arraytable._matrix_min:
		MAX_VALUE = minv + maxv
	else:
		MAX_VALUE = max(maxv, minv)

	# Add heatmap colors to tree
	cols_add_before_heat = 0
	if nameMap:
		cols_add_before_heat = 1
	for lf in tree:
		if nameMap:
			longNameFace = faces.TextFace(nameMap.get(lf.name, lf.name))
			lf.add_face(longNameFace, column=0, position="aligned")

		for i, value in enumerate(getattr(lf, "profile", [])):
			if value > center_value:
				color = gradient_color(abs(center_value - value), MAX_VALUE,
									   hue=color_up)
			elif value < center_value:
				color = gradient_color(abs(center_value - value), MAX_VALUE,
									   hue=color_down)
			else:
				color = color_center
			lf.add_face(RectFace(20, 20, color, color), position="aligned",
						column=i+cols_add_before_heat)
			# Uncomment to add numeric values to the matrix
			#lf.add_face(TextFace("%0.2f "%value, fsize=5), position="aligned", column=i)
		lf.add_face(nameFace, column=i+cols_add_before_heat+1, position="aligned")

	if nameMap and nameLabel:
		nameF = TextFace(nameLabel, fsize=7)
		#nameF.rotation = -90
		tree_style.aligned_header.add_face(nameF, column=0)
	# Add header
	for i, name in enumerate(header):
		nameF = TextFace(name, fsize=7)
		nameF.rotation = -90
		tree_style.aligned_header.add_face(nameF, column=i+cols_add_before_heat)
 #-------------END setup_heatmap----------------------------------------------
读入矩阵 (可把文后的测试矩阵存储到文件中读入)
矩阵需满足三个条件:
- 矩阵为TAB键分割,第一行是每列的名字
- 矩阵每一行第一列为行名字,与树的节点对应
- 矩阵可以存储与一个文件中,也可以是如下的字符串
data = pd.read_table("matrix", header=0, index_col=0)
data.index.name = "#Names"  #修改第一行的名字使其符合ETE的要求
data_mat = data.to_csv(None, sep="\t", float_format="%.2f")
header = list(data.columns.values)  #获取列的名字用于标记

data
| col1 | col2 | col3 | col4 | col5 | col6 | col7 | |
|---|---|---|---|---|---|---|---|
| #Names | |||||||
| A | -1.23 | -0.81 | 1.79 | 0.78 | -0.42 | -0.69 | 0.58 |
| B | -1.76 | -0.94 | 1.16 | 0.36 | 0.41 | -0.35 | 1.12 |
| C | -2.19 | 0.13 | 0.65 | -0.51 | 0.52 | 1.04 | 0.36 |
| D | -1.22 | -0.98 | 0.79 | -0.76 | -0.29 | 1.54 | 0.93 |
| E | -1.47 | -0.83 | 0.85 | 0.07 | -0.81 | 1.53 | 0.65 |
| F | -1.04 | -1.11 | 0.87 | -0.14 | -0.80 | 1.74 | 0.48 |
| G | -1.57 | -1.17 | 1.29 | 0.23 | -0.20 | 1.17 | 0.26 |
data_mat
'#Names\tcol1\tcol2\tcol3\tcol4\tcol5\tcol6\tcol7\nA\t-1.23\t-0.81\t1.79\t0.78\t-0.42\t-0.69\t0.58\nB\t-1.76\t-0.94\t1.16\t0.36\t0.41\t-0.35\t1.12\nC\t-2.19\t0.13\t0.65\t-0.51\t0.52\t1.04\t0.36\nD\t-1.22\t-0.98\t0.79\t-0.76\t-0.29\t1.54\t0.93\nE\t-1.47\t-0.83\t0.85\t0.07\t-0.81\t1.53\t0.65\nF\t-1.04\t-1.11\t0.87\t-0.14\t-0.80\t1.74\t0.48\nG\t-1.57\t-1.17\t1.29\t0.23\t-0.20\t1.17\t0.26\n'
header
['col1', 'col2', 'col3', 'col4', 'col5', 'col6', 'col7']
调用函数绘制热图
t = ClusterTree(t_str, data_mat)

ts = TreeStyle()
ts.show_leaf_name = False
ts.show_branch_length = True
ts.show_branch_support = True

setup_heatmap(t, ts, header, center_value=0, color_up=0.9, color_down=0.3, color_center="white")

t.render(file_name="%%inline", tree_style=ts)
绘制热图时修改Layout
def mylayout_only(node):
	#Change branch color
	node.img_style["hz_line_color"] = 'orange'  # change horizontal branch color
	node.img_style["vt_line_color"] = 'red' # Change vertical branch color

	# If node is a leaf, add the nodes name and a its scientific
	# name
	if node.is_leaf():
		newName = nameMap.get(node.name)
		node.img_style["size"] = 12
		node.img_style["shape"] = "sphere"
		node.img_style["fgcolor"] = "blue"
		node.img_style["bgcolor"] = colorMap[newName]
		node.img_style["hz_line_color"] = 'blue'  # change branch color
	#If node is an internal node
	else:
		# Sets the style of internal nodes
		node.img_style["size"] = 1
		node.img_style["shape"] = "circle"
		node.img_style["fgcolor"] = "darkred"


t = ClusterTree(t_str, data_mat)

ts = TreeStyle()
ts.show_leaf_name = False
ts.show_branch_length = True
ts.show_branch_support = True
ts.layout_fn = mylayout_only

setup_heatmap(t, ts, header, center_value=0, color_up=0.9, color_down=0.3,
			  color_center="white", nameMap=nameMap, nameLabel="Full")

t.render(file_name="%%inline", tree_style=ts)
测试矩阵
## 矩阵为TAB键分割
## 矩阵每一行第一列为行名字,与树的节点对应
## 矩阵可以存储于一个文件中,也可以是如下的字符串
matrix = """
#Names\tcol1\tcol2\tcol3\tcol4\tcol5\tcol6\tcol7
A\t-1.23\t-0.81\t1.79\t0.78\t-0.42\t-0.69\t0.58
B\t-1.76\t-0.94\t1.16\t0.36\t0.41\t-0.35\t1.12
C\t-2.19\t0.13\t0.65\t-0.51\t0.52\t1.04\t0.36
D\t-1.22\t-0.98\t0.79\t-0.76\t-0.29\t1.54\t0.93
E\t-1.47\t-0.83\t0.85\t0.07\t-0.81\t1.53\t0.65
F\t-1.04\t-1.11\t0.87\t-0.14\t-0.80\t1.74\t0.48
G\t-1.57\t-1.17\t1.29\t0.23\t-0.20\t1.17\t0.26
"""
产生颜色的辅助函数,给定一个列表,这个函数会自动返回一个字典包含每个字段对应的颜色。
def hex2rgb(hexcolor):
	return [(hexcolor>>16) & 0xff, (hexcolor>>8) & 0xff, hexcolor & 0xff]

def rgb2hex(rgbcolor):
	r, g, b = rgbcolor
	rgb = hex((r << 16) + (g << 8) +b)[2:].upper()
	zero = '0'* (6-len(rgb))
	return '#'+zero+rgb
#----------------------------------
def generateColor(labelL):
	labelL = list(set(labelL))
	labelL.sort()
	colorD = {}

	r = 255
	g = 255
	b = 255
	len_label = int(len(labelL) / 3 + 1)
	step = int(250 / len_label)

	cnt = 1
	for labels in labelL:
		if cnt % 3 == 1:
			r = r - step
		elif cnt % 3 == 2:
			g = g -step
		else:
			b = b - step
		cnt += 1
		color = rgb2hex([r, g, b])
		colorD[labels] = color
	return colorD

clan_colorD = generateColor(nameMap.values())
clan_colorD

{'American': '#ACFFFF',
 'Britain': '#ACACFF',
 'China': '#ACACAC',
 'Dutch': '#59ACAC',
 'Egypt': '#5959AC',
 'France': '#595959',
 'German': '#065959'}
带有Support value的Newick树,供测试不同的属性使用
nw = """
(((Dre:0.008339,Dme:0.300613)1.000000:0.596401,
(Cfa:0.640858,Hsa:0.753230)1.000000:0.182035)1.000000:0.106234,
((Dre:0.271621,Cfa:0.046042)1.000000:0.953250,
(Hsa:0.061813,Mms:0.110769)1.000000:0.204419)1.000000:0.973467);
关闭Virtual X-server
vdisplay.stop()
Ipython notebook for easy usage
https://github.com/Tong-Chen/notebook/blob/master/ETE.ipynb
Reference
- ETE tutorial http://etetoolkit.org/docs/latest/tutorial/index.html
- ETE googlegroup https://groups.google.com/d/topic/etetoolkit/pXr4B71Ozt0